02 / DATA ANALYTICS · BUSINESS INTELLIGENCE
Google Play Store
Analytics Dashboard
An interactive Power BI dashboard that turns Play Store application and review data into executive metrics, app-performance analysis and customer-sentiment views.
From data to decisions
Data preparation
Clean and explore application and review datasets, then organize the information around ratings, installs, reviews, categories and sentiment.
Dashboard design
Translate the analysis into focused views that let a user move from high-level application metrics to performance patterns and customer feedback.
Dashboard views
What the dashboard explores
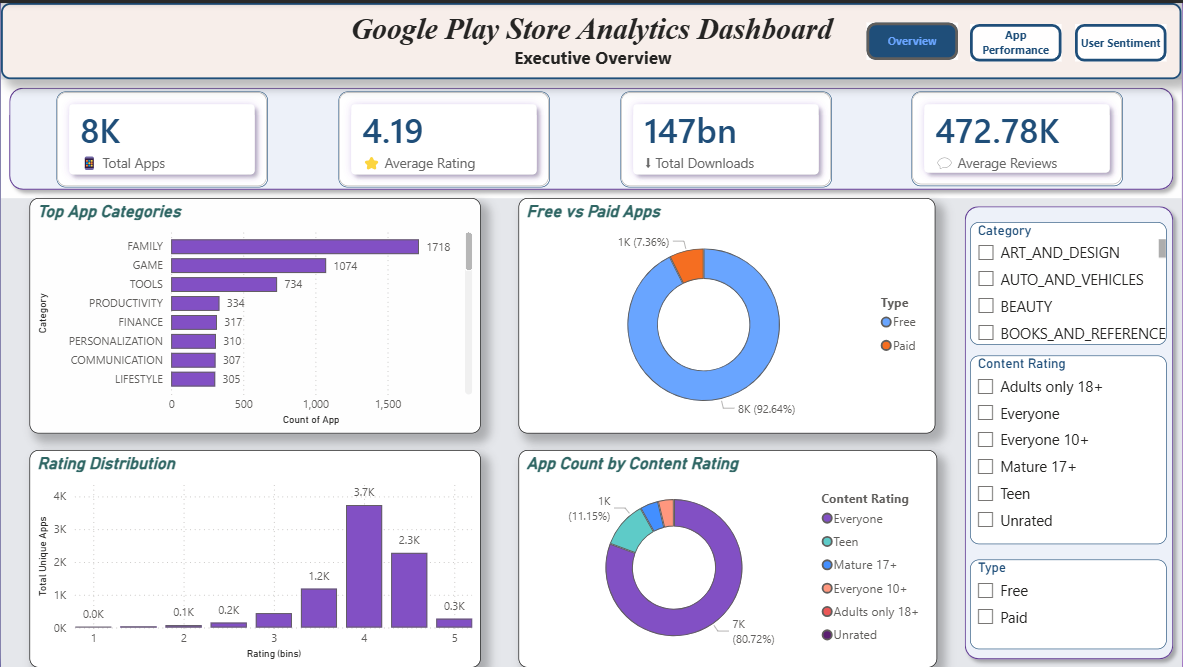
Total apps, average rating, downloads and average reviews, with category and pricing views.
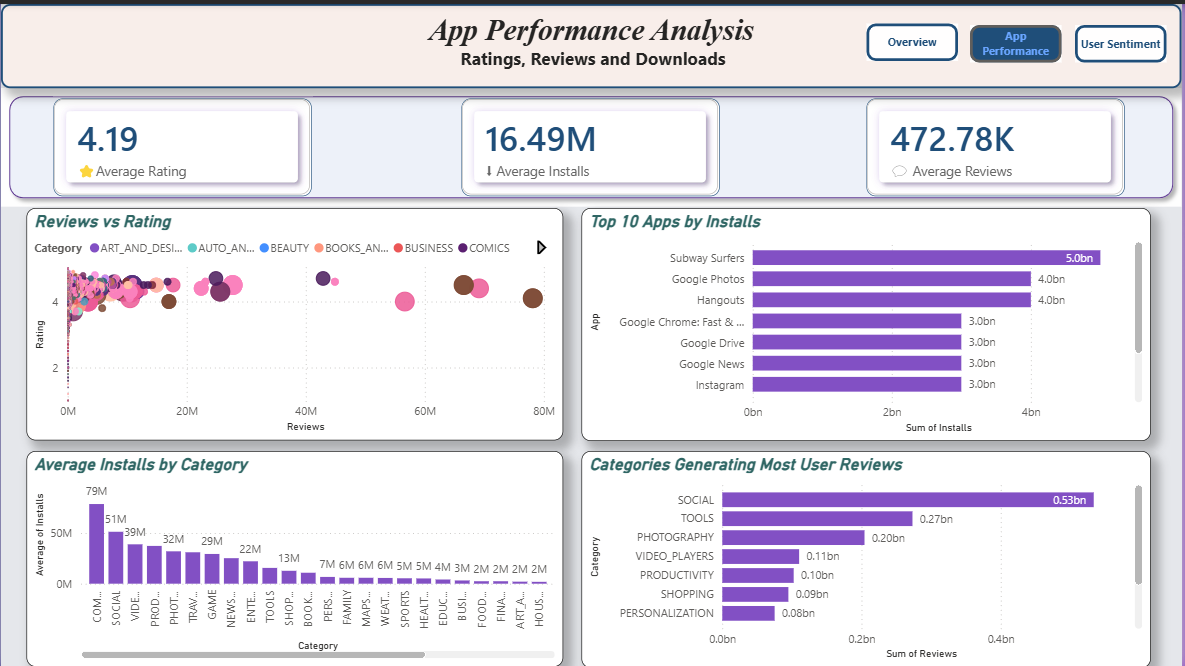
Ratings, reviews and downloads are compared to understand application performance patterns.
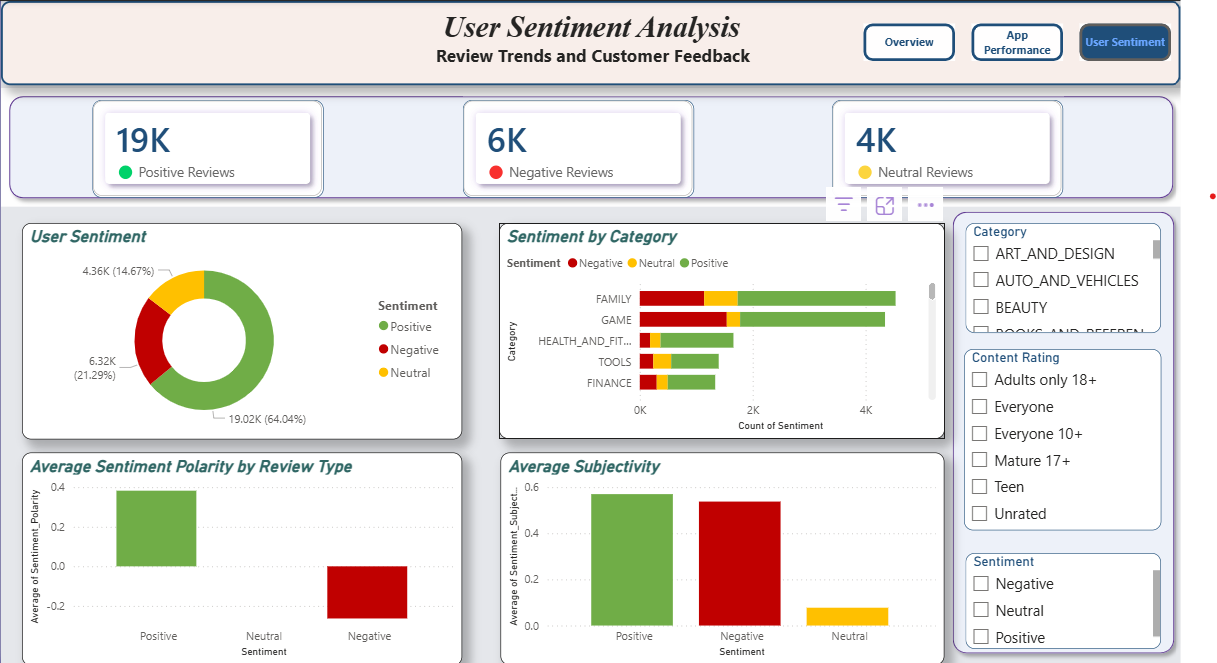
Positive, negative and neutral reviews are analyzed across categories and sentiment measures.
Category, content rating and app type filters make the dashboard useful for focused exploration.